⌚ March 24, 2014
 Most Linux distributions provide the program top for viewing processes. Top is quite useful, but Linux is about progress and improvement, so how can the usefulness of top be improved? With htop!
Htop does what we expect from top plus more by providing improved visuals with colors, easier usage, CPU/Mem/Swap bar graphs, customizable columns, a built-in help system, and the ability to kill processes by selecting them instead of by entering their process IDs (PIDs).
Process searching, filtering, sorting, and tree view (a few of the many features) are simpler to perform in htop through its menu-like navigation system. Unlike top, many of the commands can be performed by using the arrow keys or mouse pointer, and context-sensitive help shortcuts are displayed across the bottom of the terminal.
Installing htop
Depending upon the Linux distribution, htop will probably not be installed. However, it is freely available from the Ubuntu repository for Ubuntu-based distributions, such as Linux Mint and Xubuntu. Install htop from Synaptic, Software Manager, or from the terminal.
sudo apt-get install htop
Note: Xubuntu does not have Synaptic installed by default. Synaptic must be installed ahead of time.
sudo apt-get install synaptic
Running htop
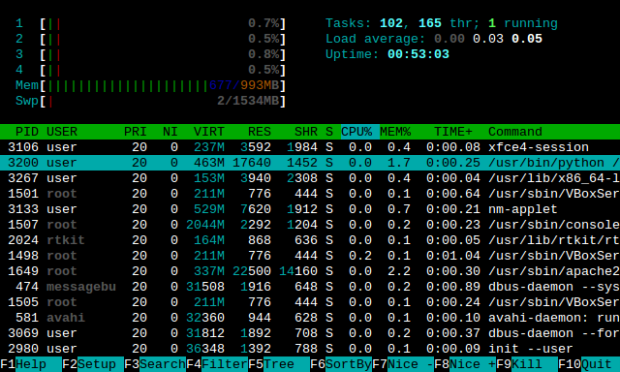
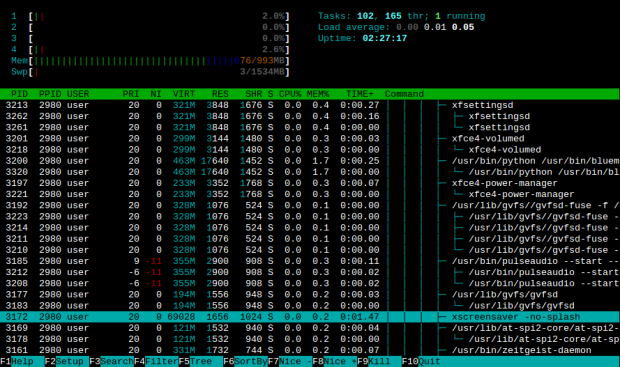
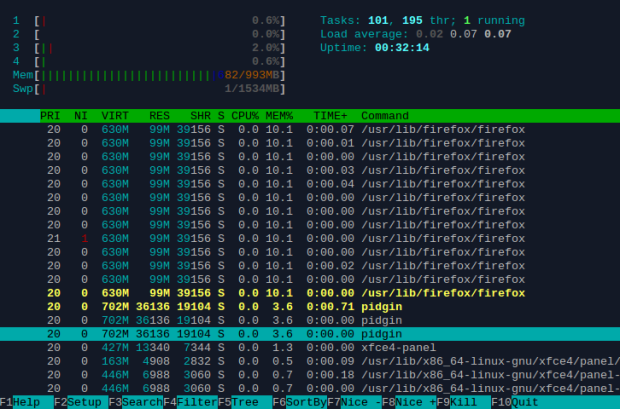
Open a terminal and enter htop. Htop occupies the full terminal space just like top. The main screen is shown below.
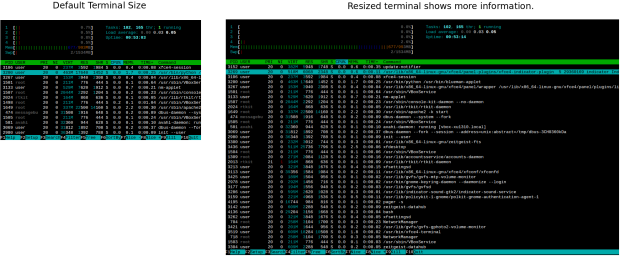
Htop will expand to fill the terminal area as the terminal window is resized to show more information. Use the Home/End/PageUp/PageDown/ and arrow keys to scroll through the process list.
Note: For those who notice the rtkit process in the listing, this is not a root kit, and yes, rtkit is normal. In Linux, the RealtimeKit (rtkit) is mainly used by pulseaudio as a mechanism to reduce latency and play skip-free audio. Breathe easy. The system has not been compromised.
Htop resizing is usually automatic, but if htop does not automatically redraw as it should, press CTRL+L to force a redraw.
Htop Arrangement
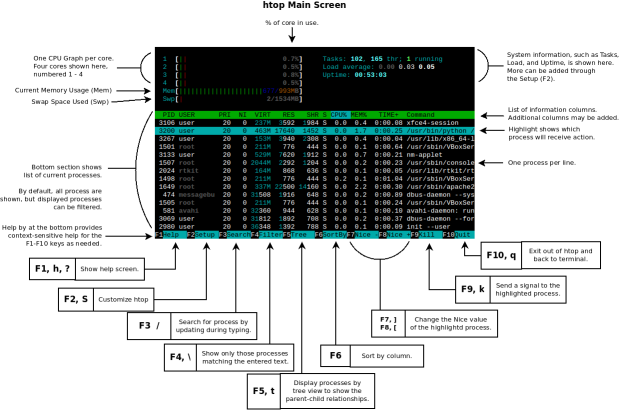
The htop main screen is divided into two parts: Top and Bottom. (Yes, imaginative naming.) The top portion displays the graphs and general information while the bottom portion lists the processes.
The F11 key will switch the terminal to full-screen mode, and htop will occupy the entire screen without window borders. This is a feature found in most terminals.
More CPU bar graphs are shown if more cores are available. Here, we see htop running on a system with an eight-core processor.
Help
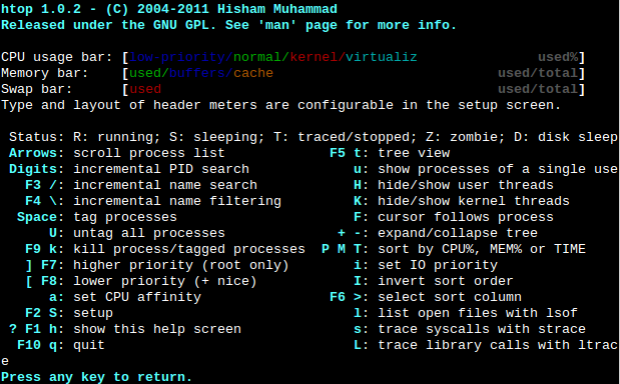
Htop provides a dedicated help screen listing keyboard commands and their brief explanations.
Press F1, ?, or h for htop help. However, this was tested inside a VirtualBox virtual machine, so F1 caused the Xubuntu help system to appear, not the htop help.
To get around this, press the ‘h’ key to show the htop help screen.
Color Schemes
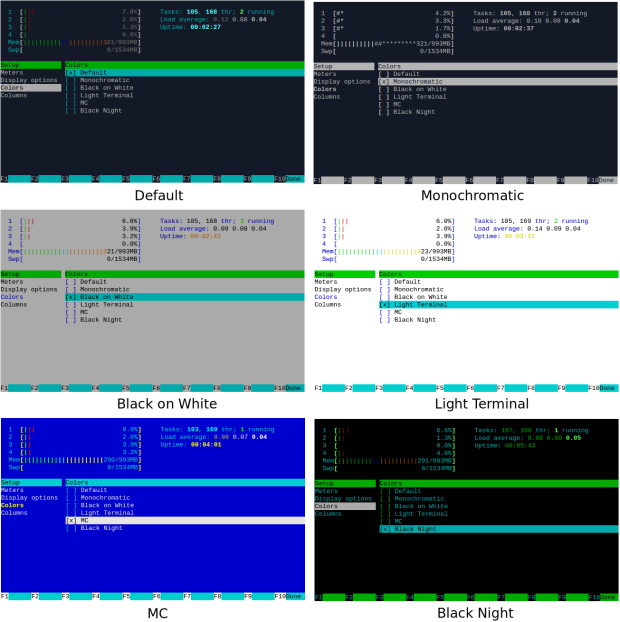
Are the colors not to your liking? Htop provides six color schemes:
- Default
- Monochromatic
- Black on White
- Light Terminal
- MC (Midnight Commander colors)
- Black Night
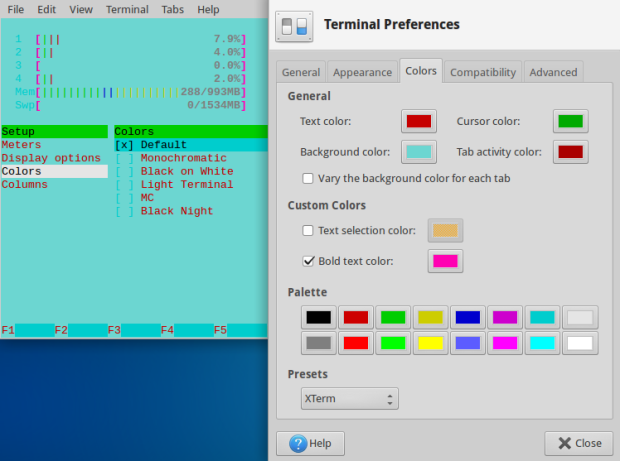
The color schemes will adjust to the color settings of the terminal, so the terminal colors can be adjusted in order to produce variations on the existing htop color schemes.
Columns and Tree View
Information is spread across columns, and each column uses cryptic abbreviations to specify what kind of information is displayed. Additional columns can be added while others can be removed in order to customize the process display. For example, the Parent Process ID (PPID) is not shown by default, but it can be added in order to show each process’s PPID.
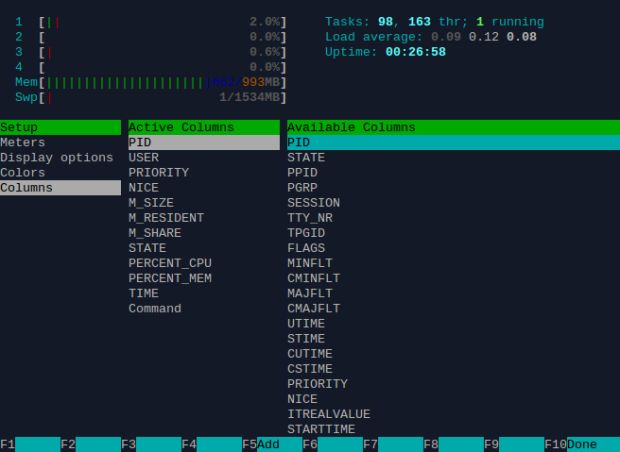
Available htop columns. Only the active columns are shown in the main screen, but more can be added from the available columns list.
Tree View
There is even a tree view (F5) that shows the process hierarchy.
This is easily one of the most useful views available.
Sorting by Column
Press F6 to arrange processes by column. A menu of the current column abbreviations will appear on the left under Sort by. Selecting a column will organize all processes by that column.
Sort by CPU%
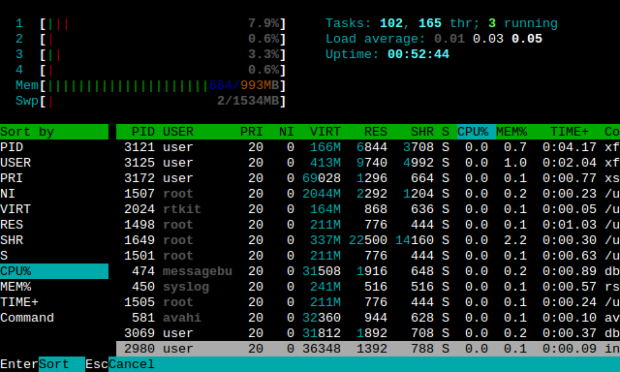
F6 activates the Sort by feature. Choose CPU% to sort processes by CPU usage. The most CPU-intensive processes will be listed from top to bottom.
Sort by USER
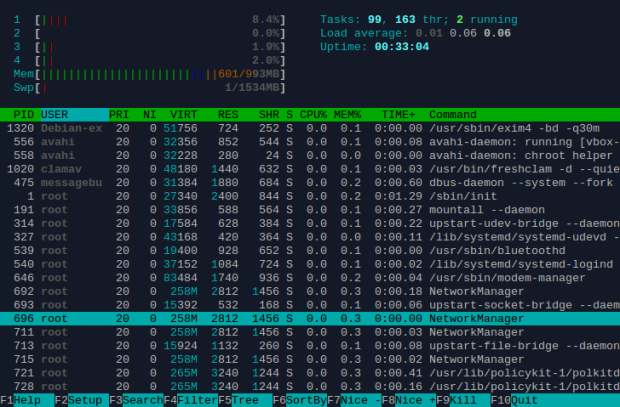
Processes sorted by user alphabetically, upper-case first. Think about ASCII codes to understand why.
Searching
F3 activates the Search feature. It operates just like searching for text in a text editor. Enter a process name or part of a name to search for, such as sbin, and htop will cycle through and highlight each matching line, in order, as F3 is pressed. All processes are shown.
Filtering
F4 activates the Filter feature, which operates similar to Search. The difference lies in which processes are displayed. Entering a process name or part of a name will show only matching lines. All other processes that do not match the filter will not appear. This is different from Search in that all processes are shown.
Customizing htop
Four customizations are possible:
- Meters
- Display options
- Colors
- Columns
Press F2 to enter Setup. Settings are saved so htop customizations will appear when htop is reopened even if the terminal is closed. Use the arrow keys or the mouse cursor to move the cursor through the menus. Press Enter or click the mouse to select the highlighted options. This applies to the help “buttons” shown along the bottom of htop.
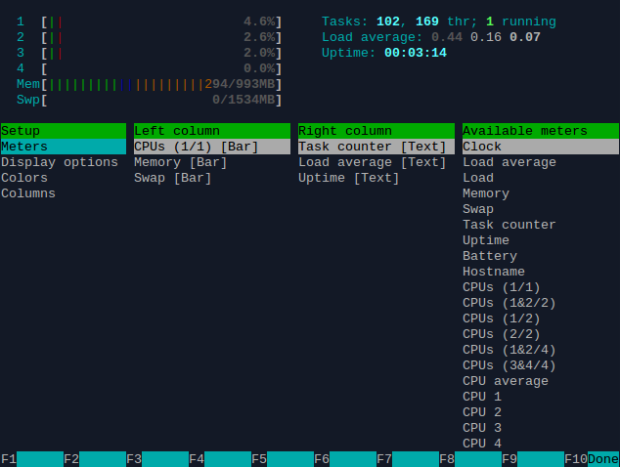
Meters
Changes how meters, such as CPU graphs, are shown. All meters are rendered in ASCII text.
There are four types of displays whose appearance might vary slightly depending upon the chosen meter:
- Bar
- Graph
- LED
- Text
Bar Meter
Display the meter as a horizontal bar.
Graph Meter
Shows activity as a graph that updates over time.
LED Meter
Emulates an LED display.
Text Meter
Displays in plain text. No ASCII graphics.
Customizing the Top Portion
The meters are found in the top section of htop. Meters can be adjusted for appearance and position into left and right columns.
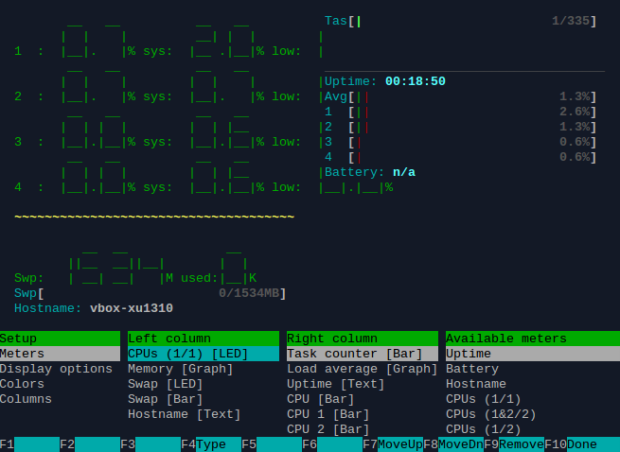
An example showing LED meters for the CPU cores along with battery life, two swap space meters, task as bar graph, and additional bar graphs for the CPU cores.
Display Options
Affects htop appearance and how processes are displayed.
Press the space bar to enable or disable a selected option.
Colors
The color scheme is chosen from the Colors screen.
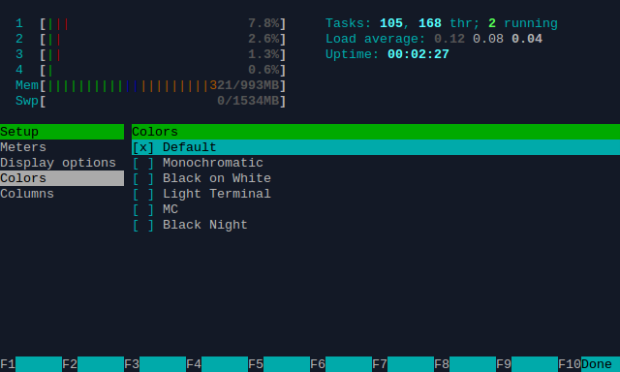
Available color schemes. Use the space bar to enable or disable a color scheme. Color scheme is affected by the terminal color scheme.
Tagging and Sending Signals
Multiple processes can be selected as a group by pressing the space bar for each highlighted process. This is called tagging, and it allows the same action to be applied to multiple processes.
We can send signals to a selected process or to a group of tagged processes by pressing the F9 key.
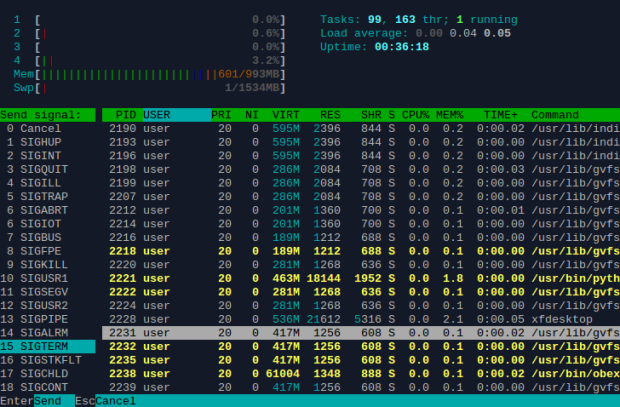
Killing a process or group of processes. Here, all yellow tagged processes will receive the same signal.
Simply select the desired signal from the Send signal column and each tagged process will receive it. This offers a convenient way to kill a process without entering its process ID (PID). By default, signal 15, SIGTERM, is selected.
Of course, if a parent process is killed, then all of its child processes will die as well. To kill a group of child processes, one way is to kill its parent. This is a convenient way to kill a group of processes by selecting their parent instead of selecting all children. Double-check to avoid killing needed child processes.
Exiting
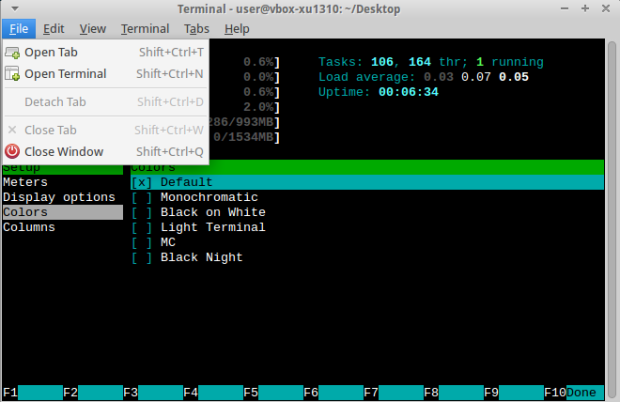
When finished using htop, the instructions specify the F10 key to exit, but in Xubuntu, htop does not exit with F10. It shows the terminal File menu instead.
By this is easily remedied. Press the ‘q’ key instead to exit, and htop will terminate.
That’s all for htop! Experimentation and general usage will show how much fun this program can be to make process management easier.
